
Post-Processing in Manatee
Analyze your electrical machine's electromagnetic & vibroacoustic behavior
Post-Processing of Simulation Results in Manatee
Manatee software offers comprehensive post-processing tools for analyzing e-NVH simulation results, including Order Tracking Analysis to visualize the contribution of excitation frequencies to vibration and noise. Variable-speed Spectrogram analysis helps identify the root causes of resonances by visualizing spectrum variations across operating points. The software supports Torque Speed Plane Calculations to map noise and vibration levels across different operating conditions, and Operational Deflection Shape (ODS) analysis to visualize dynamic deflections. Additionally, Operational Force Shape (OFS) analysis provides insights into magnetic forces, and Sound Quality Metrics quantify perceived sound attributes, helping engineers optimize acoustic performance and reduce annoyances. These tools facilitate collaboration among electrical, mechanical, and NVH engineers in diagnosing and mitigating noise and vibration issues in electric machines and drives.
Insightful e-NVH Data Exploration
- Order Tracking Analysis
- Variable-Speed Spectrogram Analysis
- Torque Speed Plane Calculations
- Operational Deflection Shape
- Operational Forces
- Sound Quality Metrics
Order Tracking Analysis
Order Tracking Analysis is available for different quantities such as the Sound Power Level, the Sound Pressure Level or the vibration displacement, velocity, and acceleration. If several sets have been defined in the imported 3D FEA mechanical model, they can be selected to focus on a particular sensor or panel contribution to sound power.
Besides, order levels can be visualized as a function of frequency or speed. The frequency axis allows to capture which orders are resonating with the same structural mode. Natural frequencies and structural modes can be displayed in the same graph to identify the implication of a given mode on a resonance peak.
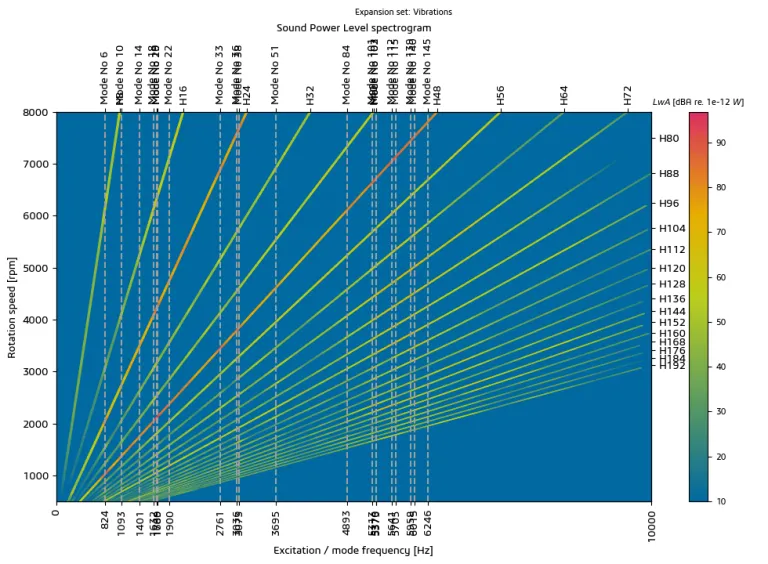
Variable-Speed Spectrogram Analysis
In Manatee software, spectrogram visualization can efficiently analyze the vibration and acoustic noise of electric drives induced by e-machine electromagnetic excitations. Spectrograms allow one to visualize how a spectrum (flux, force, vibration or noise) varies along a series of operating points (different speeds or time stamps). Contrary to the Magnetic Frequency Signature Analysis tool, spectrograms contain magnitude information on spectral lines. The level of each harmonic can be analyzed using Order Tracking analysis. Spectrograms come with different options to ease interpretation, such as Load Case filtering and display of natural frequencies or orders.
Spectrograms and automated Order Tracking analysis are key visualization tools available at the end of every e-NVH simulation under Manatee. It can be applied to several multiphysic model outputs (flux, force, vibration, noise). Electrical, mechanical and acoustic engineers can use spectrograms to quickly identify the root cause of resonances in terms of electromagnetic excitation frequency and wavenumber.
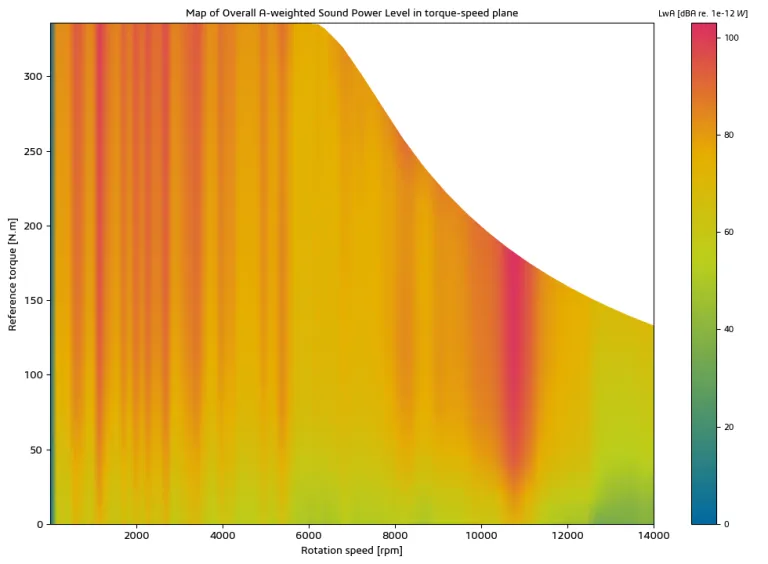
Torque Speed Plane Calculations - Noise Maps
Manatee's torque/speed plane feature allows its users to characterize the magnetic noise and vibration levels in the whole torque/speed plane, that is, on the four quadrants (traction / braking / reverse modes) of their electric machine, including noise map plots. Calculations can be quickly carried out using Manatee's Magnetic Look-Up Table feature.
Resonances due to electromagnetic excitations may occur at partial load, not necessarily at maximum torque or current levels. Noise due to magnetic forces may also differ in the traction or braking phase. This feature allows electrical and acoustic engineers to calculate acoustic noise and vibrations due to Maxwell forces in electric motors' whole torque/speed plane and synthesize sound levels at different torque levels.
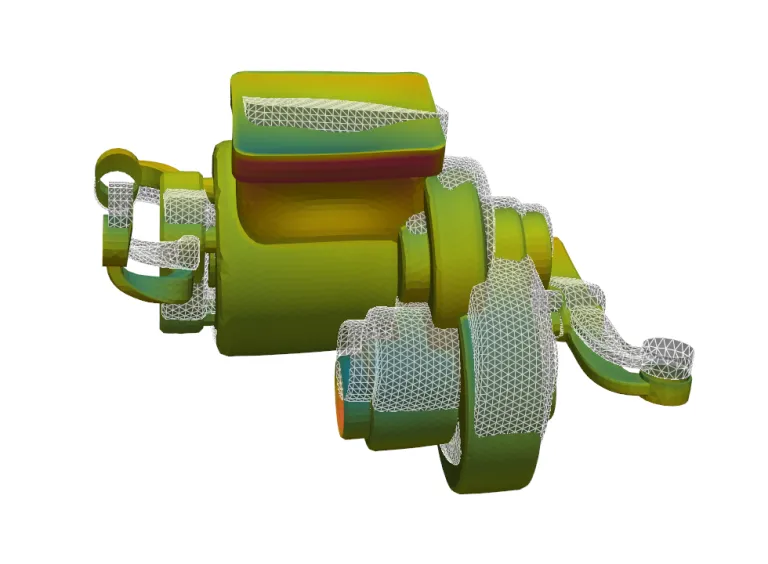
Operational Deflection Shape
Operation Deflection Shape (ODS) analysis directly visualizes system-level dynamic deflections at a given operating point and frequency. Frequencies can be selected for mechanical orders (multiple of H1, rotor mechanical frequency) or electrical orders (multiple of fundamental electrical frequency). ODS is the analog of the exciting force Operational Force Shape (OFS) for structure deflections.
Both mechanical mesh and operational forces can be overlayed. The scale of the deflection shape can be changed, and the resulting animation can be saved.
This feature allows electrical, mechanical and NVH engineers to interpret resonances during the virtual prototyping of electrical machines, identifying the modes involved in vibration/noise generation (complementary to Modal Unit Force). Visualization of structural deflections can be done with operational forces. Far below resonance, exciting forces and deflections are in phase. At resonance, exciting forces and deflections are 180° out of phase.
ODS may help mechanical, and NVH engineers identify the most relevant regions to be stiffened.
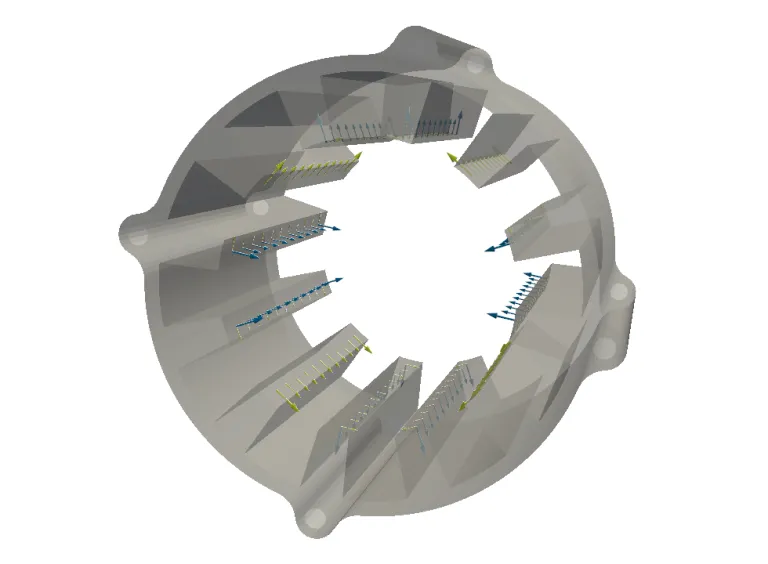
Operational Forces
Operational Force Shape (OFS) analysis provides a direct visualization of system-level dynamic magnetic forces at a given frequency or for a given Load Case. Frequencies can be selected for mechanical orders (multiple of H1, rotor mechanical frequency) or electrical orders (multiple of fundamental electrical frequency). It is the analog for exciting forces of the excited structure Operational Deflection Shape (ODS).
OFS can be visualized in 3D or in 2D in the plane of a slice (especially useful for skewed electrical machines).
This feature allows electrical engineers to visualize the shape of magnetic excitations and mechanical engineers to analyze the root cause of resonance during the virtual prototyping of electrical machines. Tangential and radial forces may act in phase or anti-phase, resulting in constructive or destructive interference at the vibration level.
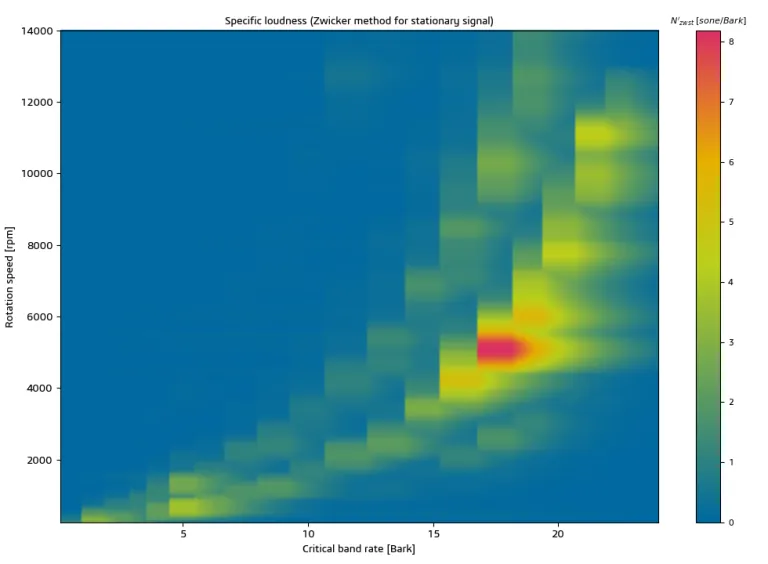
Sound Quality Metrics
Manatee calculates Sound Pressure Levels and synthesizes the sound of electrical systems by combining magnetic noise from the electrical machine with imported non-magnetic noise. The total sound signature can be analyzed using Sound Quality metrics to quantify perceived sound attributes beyond simple Sound Power Level.
Available psychoacoustic metrics include Loudness, Sharpness, and Roughness, which help assess the acoustic annoyance of electric drives. These metrics are crucial because the physical Sound Power Level alone may not capture the subjective perception of sound, leading to customer rejections due to unpleasant tonalities or modulation effects. Sound Quality metrics enable engineers to analyze and address system-level acoustic issues effectively.
FAQs about Post-Processing in Manatee
Also Discover

Set up Electric machine and drive models for simulation
Fast and accurate simulation models for multi-physics workflows
Analyze your electrical machine's electromagnetic & vibroacoustic behavior
Comprehensive root cause analysis tools for magnetic noise and vibrations
Manatee provides dedicated reduction techniques for magnetic noise and vibrations
Learn What SIMULIA Can Do for You
Speak with a SIMULIA expert to learn how our solutions enable seamless collaboration and sustainable innovation at organizations of every size.
Get Started
Courses and classes are available for students, academia, professionals and companies. Find the right SIMULIA training for you.
Get Help
Find information on software & hardware certification, software downloads, user documentation, support contact and services offering