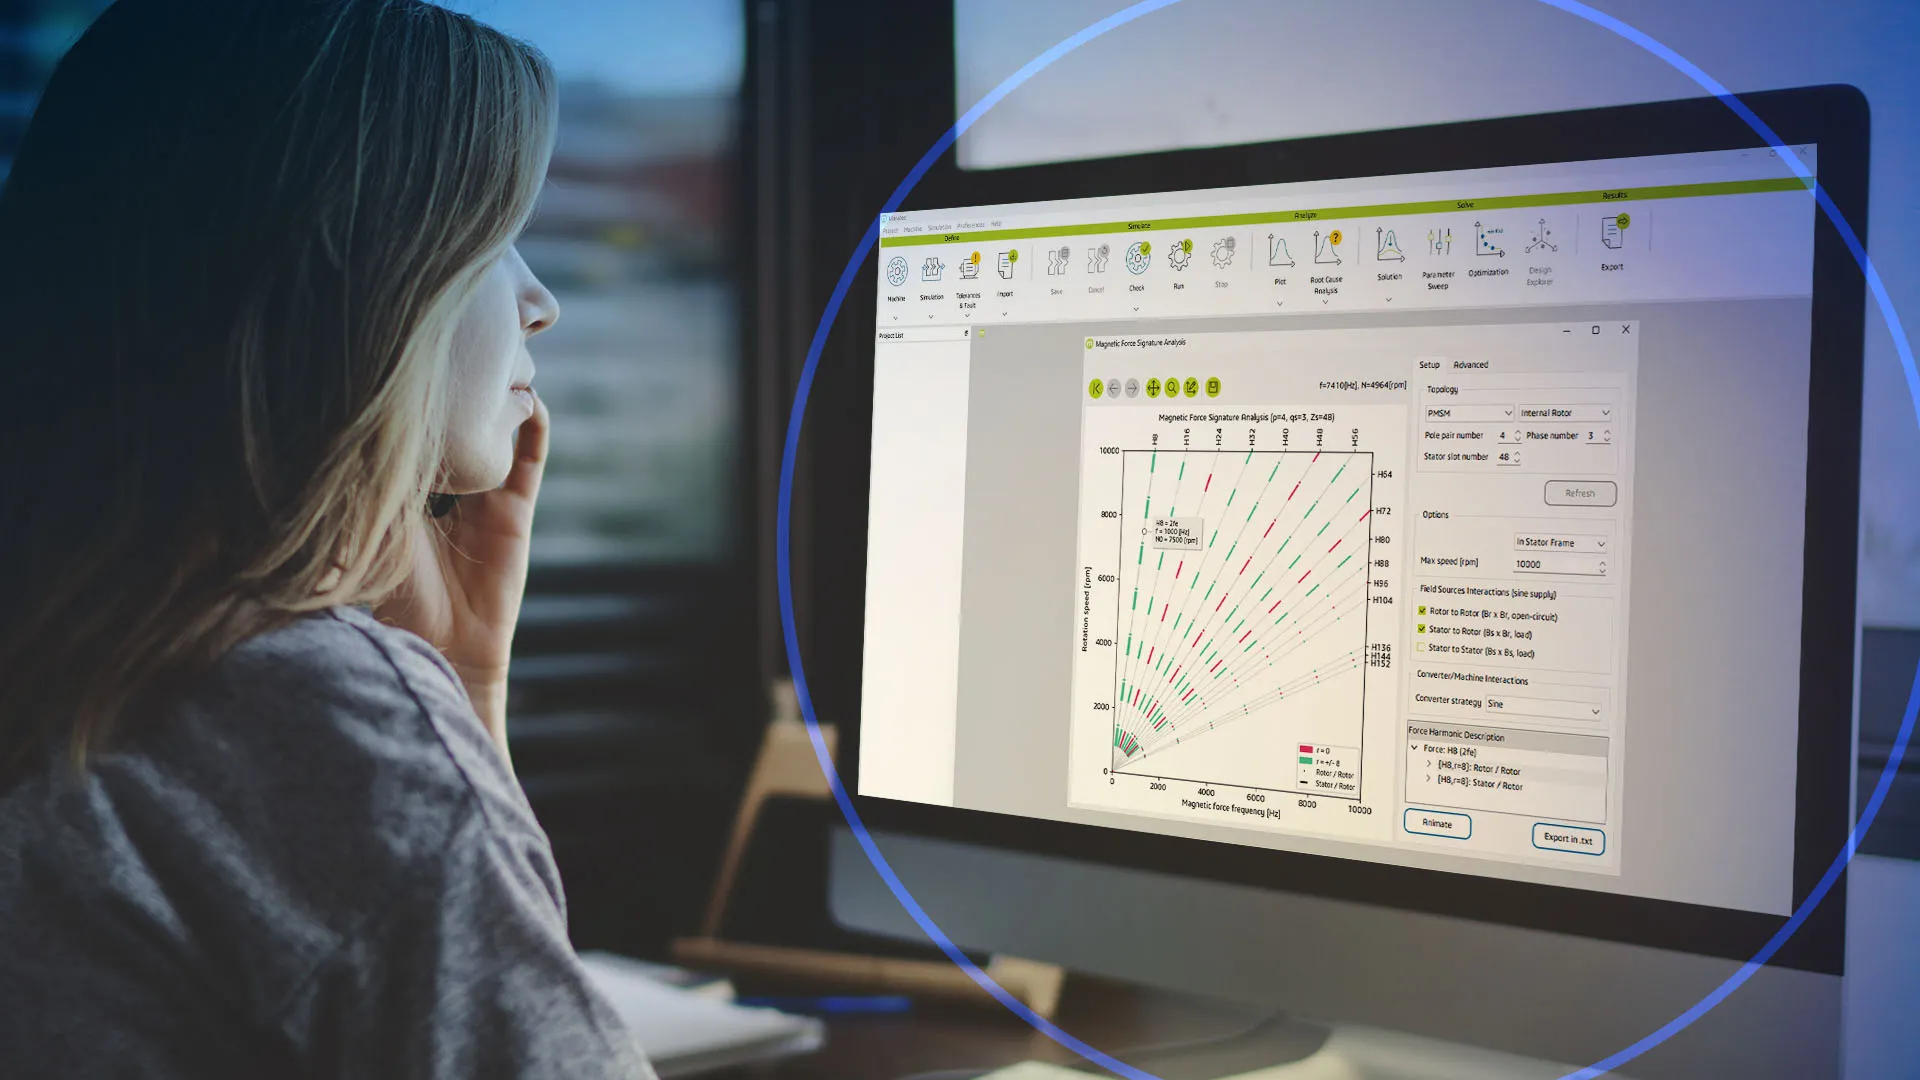
Advanced e-NVH Analysis
Comprehensive root cause analysis tools for magnetic noise and vibrations
Manatee Analysis Methods for e-NVH
Manatee software provides advanced e-NVH analysis tools, including interactive plots for visualizing simulation results and performing mathematical post-processing. The Magnetic Force Signature Analysis tool helps identify the frequency signature of magnetic force harmonics, aiding in the early design phase and optimization of electric machines. Spatiograms (or Load Case Contribution) offer a unique way to visualize vibration and noise results per electromagnetic load case. At the same time, the Linear Contribution Plot helps identify the root causes of e-NVH issues by showing the percentage contribution of each load case to overall noise or vibration. These tools enable electrical, mechanical, and NVH engineers to quickly understand and mitigate noise issues, facilitating efficient design and optimization of electric machines and drives.
Advanced e-NVH Root Cause Analysis Tools
- Interactive Plots
- Magnetic Force Signature Analysis
- Spatiogram
- Linear Contribution Plot
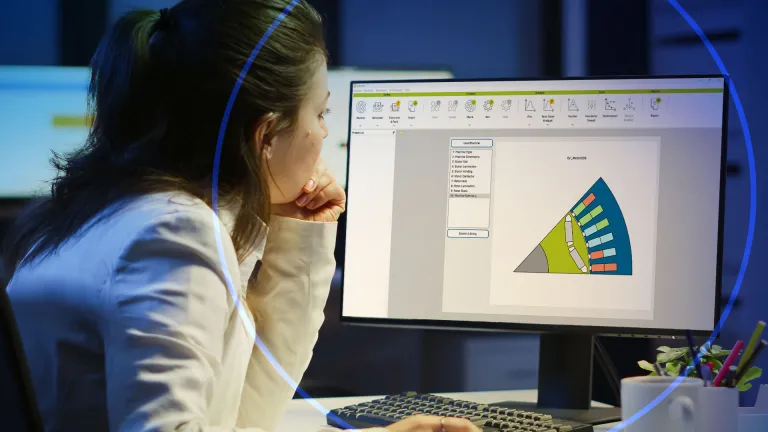
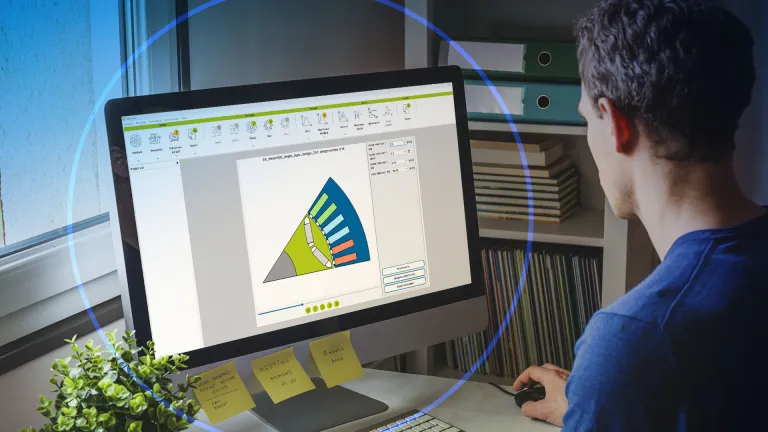
Interactive Plots
In Manatee software, a selection of relevant plots is automatically generated at the end of the electrical machine simulation. Depending on the chosen workflow, they may include electrical, electromagnetic, structural mechanics or acoustic quantities.
Each plot can be undocked to access further interactive options. The icon banner also offers shortcuts to standard plots (spectrums, spectrograms, order tracking analysis, torque-speed maps). All plots include mathematical post-processing (e.g., Fourier transform in 1D or 2D) and can be animated in time or space. Most can be exported in raw format (e.g., .csv).
All engineers involved in the development of electric drives can access insightful visualization tools of the most relevant physics. Post-processing of simulation outputs does not need to be carried out in another environment, making result interpretation faster
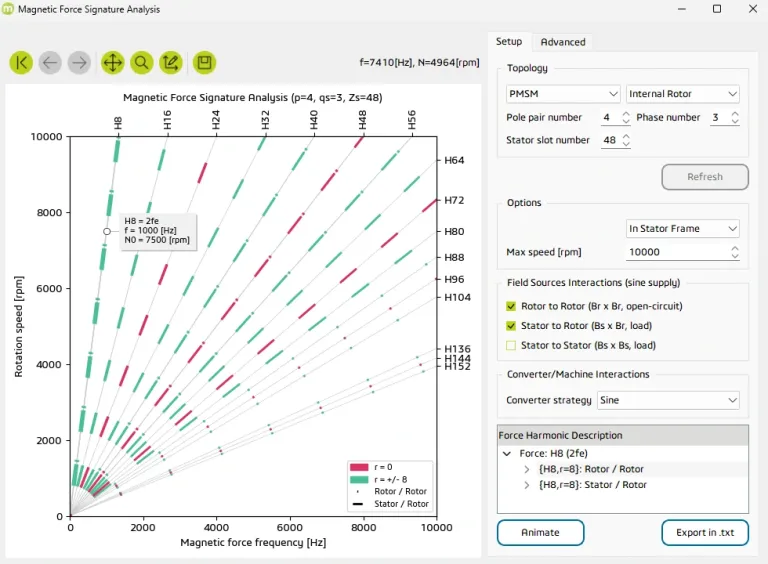
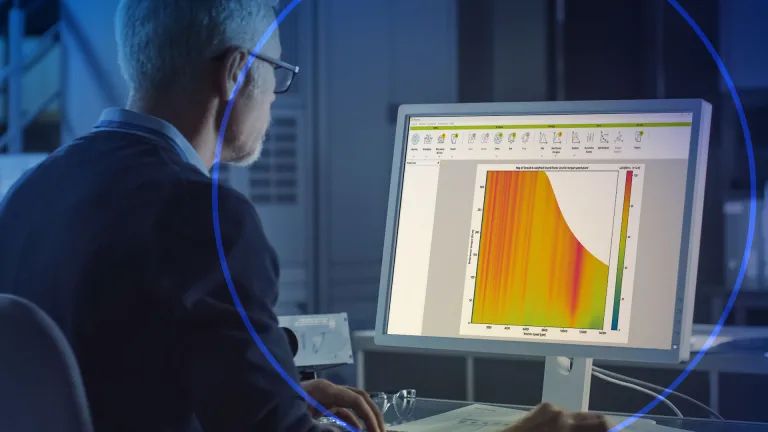
Magnetic Force Signature Analysis
Manatee e-NVH software provides a frequency signature of primary magnetic force harmonics based on slot/pole/phase combinations, machine topology, load state, and supply type. The saturation harmonics for induction machines are also included. Using analytic models, it delivers instantaneous results, facilitating what-if scenarios. The results are presented as a Campbell diagram, showing magnetic lumped force harmonics as a function of speed and frequency, and identifying the physical origin of magnetic load cases.
Electrical engineers can use the Magnetic Force Signature Analysis (MFSA) tool in the early design phase to compare Maxwell excitations among different topologies and identify the harmonic origin of electromagnetic excitations for optimization. Mechanical and acoustic engineers can estimate the main resonances between magnetic force harmonics and lamination modes. NVH test engineers can use it to identify electromagnetic excitations from experimental spectrograms and distinguish magnetic noise from other sources.
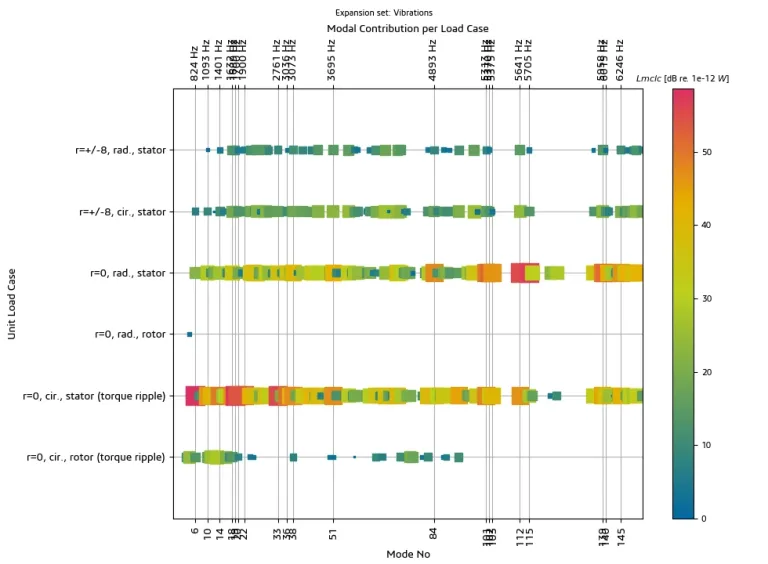
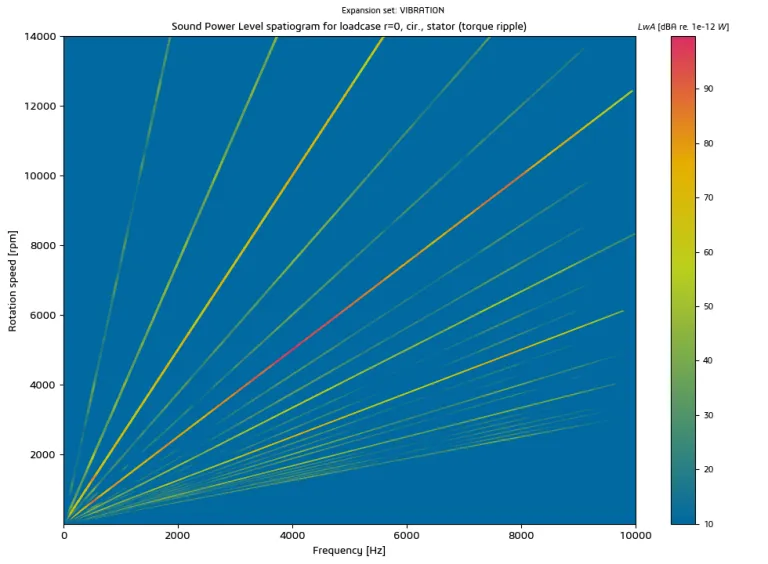
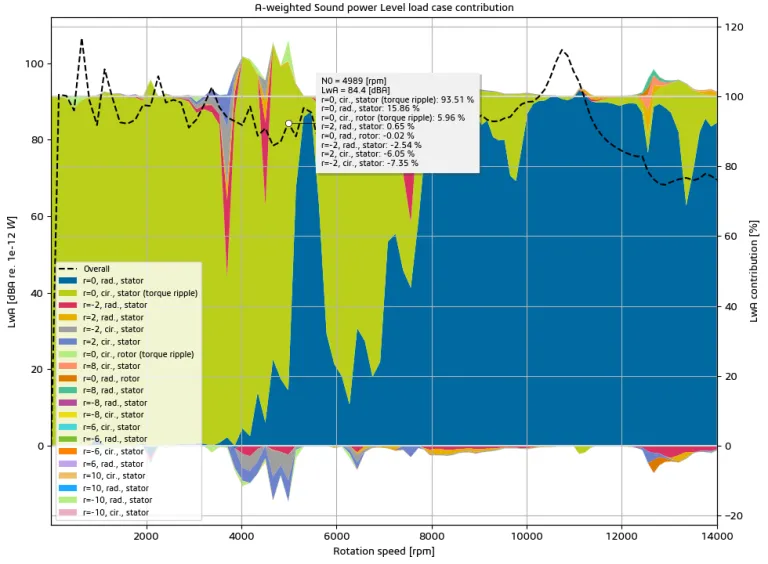
Spatiogram - Load Case Contribution
Spatiogram is a unique visualization tool of Manatee software that gives variable-speed vibration and noise results (spectrograms) per electromagnetic Load Case. This is one of Manatee's software tools for quickly understanding the nature of electromagnetic excitations responsible for acoustic noise issues.
The Electromagnetic Vibration Synthesis algorithm naturally allows splitting the vibroacoustic contribution of each Load Case. A load case is defined by a magnetic force wavenumber (e.g., r=0 for a pulsating force along the airgap), a direction of application (e.g., radial), and a set of application nodes (e.g., stator tooth tip nodes). Torque ripple observed by the stator and unbalanced magnetic pull observed by the rotor are two examples of load cases.
The split of Load Case and structural mode contributions to the overall noise level allows both electrical and mechanical engineers to quickly understand the problem and implement noise mitigation techniques. Contrary to general-purpose FEA software, Manatee results come with powerful post-processing to speed up result interpretations
Linear Contribution Plot
Manatee software offers powerful tools to identify the root cause of e-NVH issues. One of these tools is the Load Case contribution plot which allows to quickly visualize the linear contribution of each load case to the overall noise or vibration and which is expressed in percentage.
Note that in dB/dBA, a 50% linear contribution corresponds to a 3dB contribution.
Mechanical and NVH engineers can use the contribution plot to quickly identify the root cause of the e-NVH issue, whether air-borne or structure-borne, radial or circumferential.
An automatic split of internal/external and radial/circumferential load cases is also available through the “Split contributions” button to understand whether the e-NVH issue is air-borne or structure-borne, radial or circumferential along the speed. In particular, the effect of torque ripple and unbalanced magnetic pull on the stator and rotor can be separated.
FAQs about Advanced eNVH analysis
Also Discover
Set up Electric machine and drive models for simulation
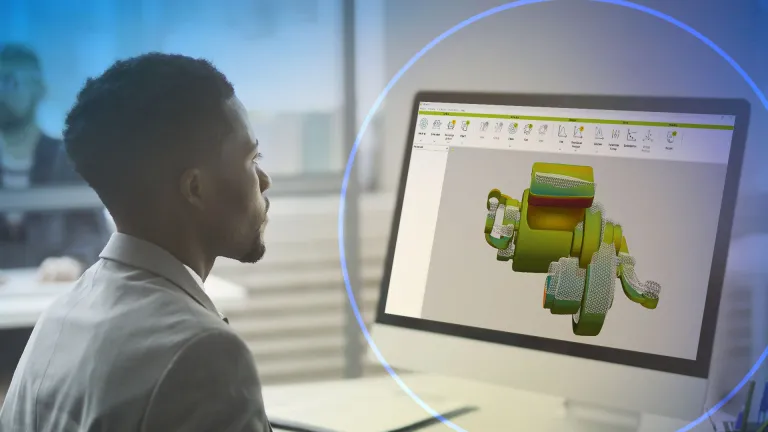
Fast and accurate simulation models for multi-physics workflows
Analyze your electrical machine's electromagnetic & vibroacoustic behavior
Manatee provides dedicated reduction techniques for magnetic noise and vibrations
Integrate Manatee into existing CAE workflows
Learn What SIMULIA Can Do for You
Speak with a SIMULIA expert to learn how our solutions enable seamless collaboration and sustainable innovation at organizations of every size.
Get Started
Courses and classes are available for students, academia, professionals and companies. Find the right SIMULIA training for you.
Get Help
Find information on software & hardware certification, software downloads, user documentation, support contact and services offering