PowerVIZ
Visualization for Results Analysis for Powerflow Simulations
PowerVIZ - Result Visualization
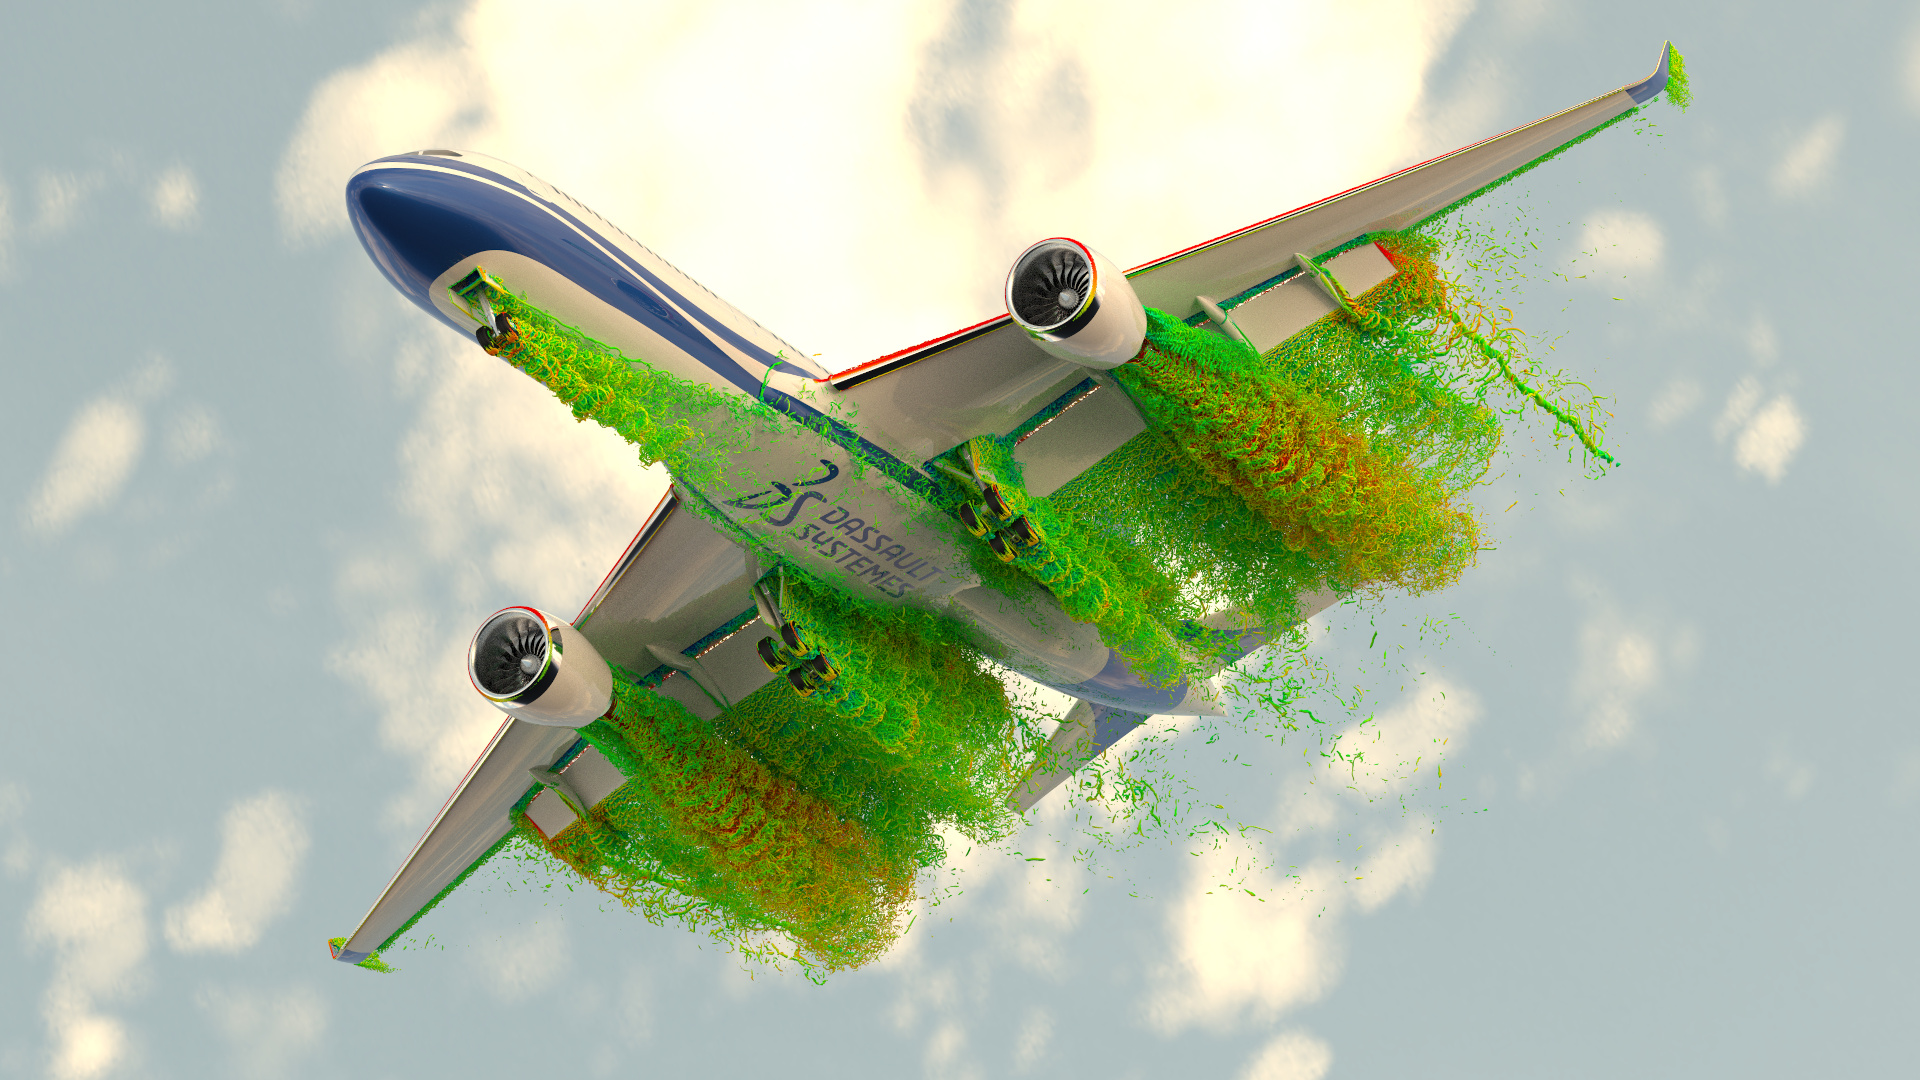
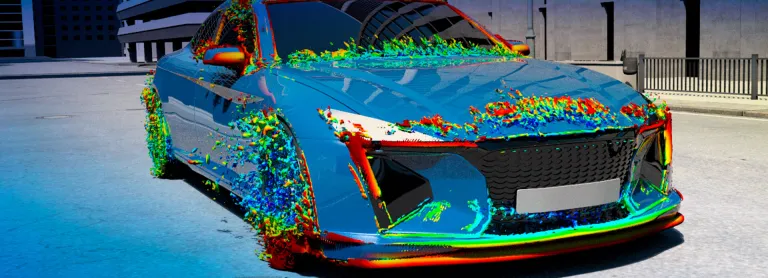
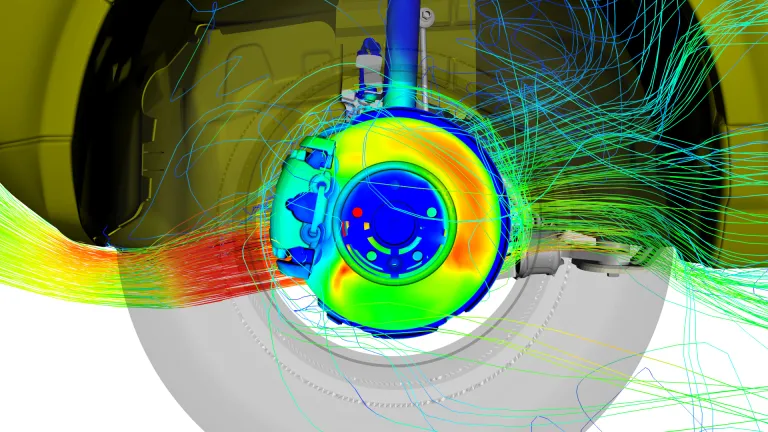
PowerVIZ® is a high-performance CFD visualization tool that enables you to analyze PowerFLOW simulation results interactively. With PowerVIZ, you can interactively move slices, point probes, streamline rakes, and particle sources throughout the fluid domain to observe how flow patterns evolve and change. PowerVIZ provides fast, interactive visualization of even the largest data sets, and enables you to easily combine different visualization techniques to explore simulation data.
- Features & Benefits
- Key Capabilities
Features & Benefits
- Super high-performance. PowerVIZ is acknowledged by our customers as easy to use with its interactive and intuitive user interface, high performance on even the largest data sets and flexible with dozens of analysis techniques.
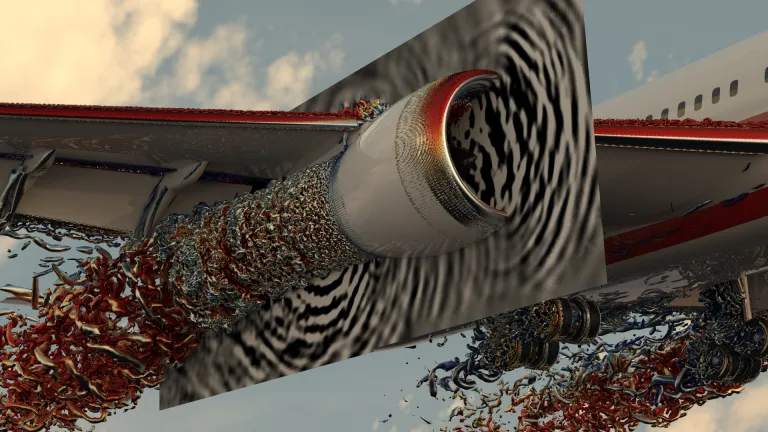
- Deep product performance insight.PowerVIZ's best-in-class visualization techniques enable you to identify, study, and communicate transient flow details.
- Realistic communication of results. Stereo viewing, real-time volume visualization, photo-realistic rendering, and animations of transient effects provide clear and powerful communication of simulation results.
- Accurate quantitative analysis. PowerVIZ has built-in features to compute specific, meaningful quantities such as net force and mass flux, and can integrate any quantity in the fluid or on the surface. Its detailed images can illustrate complex flow features.
- Soiling & water management. Using the optional soiling module, particle motion, surface bounce, and hit points are easily studied.
- Automation. PowerINSIGHT can standardize and automate the production of PowerVIZ content, saving you valuable time.
Key Capabilities
Fluid measurement visualization
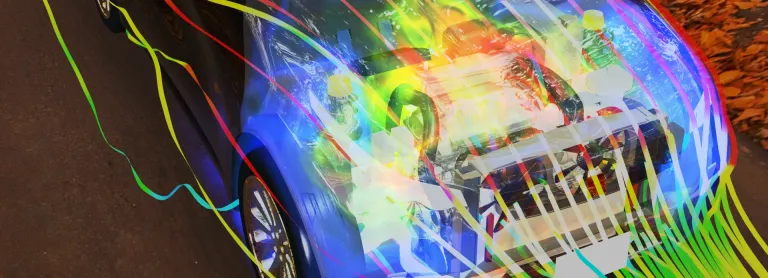
- Axis-aligned and freely movable slice planes with contours, flooded contours, 2D streamlines, and vector display options
- Isosurfaces, optionally colored by fluid property values
- Vortex region and core detection
- Ability to measure flux through arbitrarily complex openings
- Ability to locate property extremes in the flow field
- 3D streamlines with line, ribbon, 3D arrow, and animated 3D arrow options
- Volumetric integration
- User-defined variables using a full-featured equation language
Surface measurement visualization
- Surface contours
- Surface streamlines
- Integration and averaging over surfaces and parts
- Graphs of surface property values
- User-defined variables using a full-featured equation language
Quantitative analysis
- Force development graphs
- Torque and lift coefficient calculations
- Time graphs of almost any surface or fluid property
- Graphs of a property along an arbitrary line
Soiling & water management
- Arbitrary particle emission rakes
- Particle tracing with or without mass
- Accounts for gravitation, fluid drag, and near-surface effects
- Particle-surface bounce, stick, and re-entrainment
- Measurement of surface hit points and accumulation density
Animations
- Keyframe animation supports the creation of sophisticated movies
- Can include streamlines, particle traces, and hit points
Real-time volume visualization & animation
Volume visualization is a technique for directly displaying and manipulating a 3D scalar field in real time; you can choose either direct volume rendering or volume-based isosurface rendering. PowerVIZ exploits the massive floating-point capabilities of modern graphics processors (GPUs) to perform real-time volume visualization — impractical on conventional CPU systems as it is too compute-intensive.
Photorealistic rendering
Almost all of the PowerVIZ visualization techniques can be exported as VRML and imported into photo-realistic rendering packages such as DeltaGen, providing a life-like image of the vehicle with overlaid simulation results.
Stereo viewing
You can view PowerVIZ data in 3D stereo. With the proper graphics hardware and glasses, your PowerFLOW simulation data is easy to communicate.
Comparative analysis
You can apply identical visualization techniques to multiple measurement data sets simultaneously. PowerVIZ synchronizes the views as you manipulate the models in 3D to easily compare the results.
Also Discover
Learn What SIMULIA Can Do for You
Speak with a SIMULIA expert to learn how our solutions enable seamless collaboration and sustainable innovation at organizations of every size.
Get Started
Courses and classes are available for students, academia, professionals and companies. Find the right SIMULIA training for you.
Get Help
Find information on software & hardware certification, software downloads, user documentation, support contact and services offering
